Distress & Urban Decay
Permit Momentum Index
Census block group–level building permit activity index comparing the most recent five-year period against the prior baseline — producing a momentum ratio, directional classification, and composite score to surface neighborhoods accelerating, stalling, or in decline.
About this product
Construction permit activity is one of the most reliable leading indicators of neighborhood trajectory. A single parcel's permit history is noisy; aggregated to the census block group, the signal emerges cleanly. The Permit Momentum Index computes per-parcel permit rates for two non-overlapping five-year windows — 2020–2025 (recent) and 2015–2019 (baseline) — then derives a momentum ratio and classifies each block group as accelerating, stable, or decelerating.
The index is constructed at census block group grain — the CRA-reportable geography used by CDFIs and community lenders for investment and lending activity reporting. Each block group carries an activity rate (permits per parcel), a momentum ratio, a directional label, a composite momentum score (0–100), and decomposed type indicators for new construction, demolitions, and permit dormancy.
The composite score weights permit activity (40%), momentum direction (35%), and non-dormancy (25%) using population-relative PERCENT_RANK — so a score of 75 means the block group outperforms 75% of Caddo Parish on the weighted composite. Delivery is CSV (one row per block group) and GeoJSON for direct import into mapping tools.
Buyers
- → CDFIs and community lenders using block group activity for CRA mapping and investment targeting
- → Economic development offices tracking neighborhood reinvestment trajectories
- → Municipal planners and housing authorities allocating CDBG and HOME funds
- → Investors screening for momentum-positive neighborhoods before block-level acquisition
Delivery
- ·CSV — one row per block group with all index fields
- ·GeoJSON — block group polygons with all fields as properties for direct mapping import
- ·Quarterly refresh aligned to calendar year-end
- ·Caddo Parish coverage; Bossier and DeSoto pending permit data acquisition
Data Preview
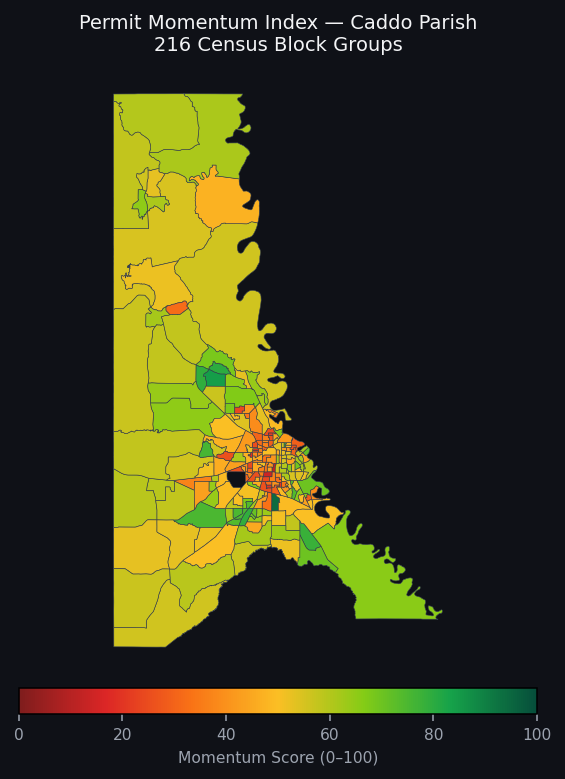
Composite momentum score (0–100) by census block group. Green = accelerating reinvestment; red = declining permit activity.
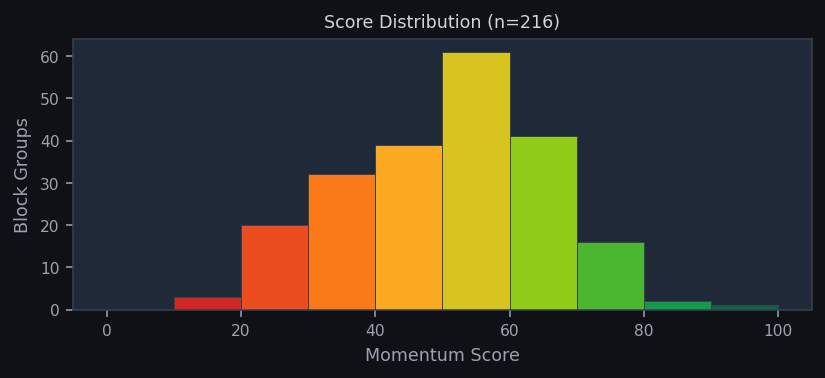
Score distribution across 216 Caddo Parish block groups. 98 accelerating, 74 stable, 44 decelerating.
Dataset Fields