Distress & Urban Decay
Assessment Value Spatial Pattern Dataset
Parcel-level Local Indicators of Spatial Association (LISA) computed on assessor fair market values across 230,000+ tri-parish parcels — identifying statistically significant high-value and low-value spatial clusters at the parcel level.
About this product
This dataset applies Local Indicators of Spatial Association (LISA), a well-established spatial statistics method developed by Luc Anselin (1995), to assessor fair market values across all parcels in Caddo, Bossier, and DeSoto parishes. The result is a parcel-level classification of spatial clustering in assessed values — identifying areas where high-value properties cluster together (HH), low-value properties cluster together (LL), and transition zones where valuations diverge from their immediate neighborhood context (HL, LH).
Each parcel is assigned a LISA quadrant for three value dimensions: land value, improvement value, and the differential between the two. Z-scores quantify how far each parcel's value deviates from the parish mean, and p-values indicate whether the observed clustering is statistically significant. Spatial gradients describe the directional pattern of value change in each parcel's local neighborhood.
The dataset is produced at parcel grain and delivered as a flat file. It contains no derived scores or editorial conclusions — the LISA quadrant, z-score, and raw FMV figures are the output. Interpretation is left to the buyer.
Buyers
- → Tax and real estate attorneys researching assessed value patterns for appeals or litigation support
- → Academic and policy researchers studying spatial patterns in property valuation
- → CDFIs and community development organizations mapping investment climate by neighborhood
- → Journalists and data professionals analyzing assessor records
Delivery
- ·CSV — one row per parcel with all LISA fields and raw FMV values
- ·GeoJSON — centroid-point file for direct mapping import, delivered by parish
- ·Quarterly refresh aligned to assessor data updates
- ·Tri-parish coverage: Caddo, Bossier, DeSoto
Data Preview
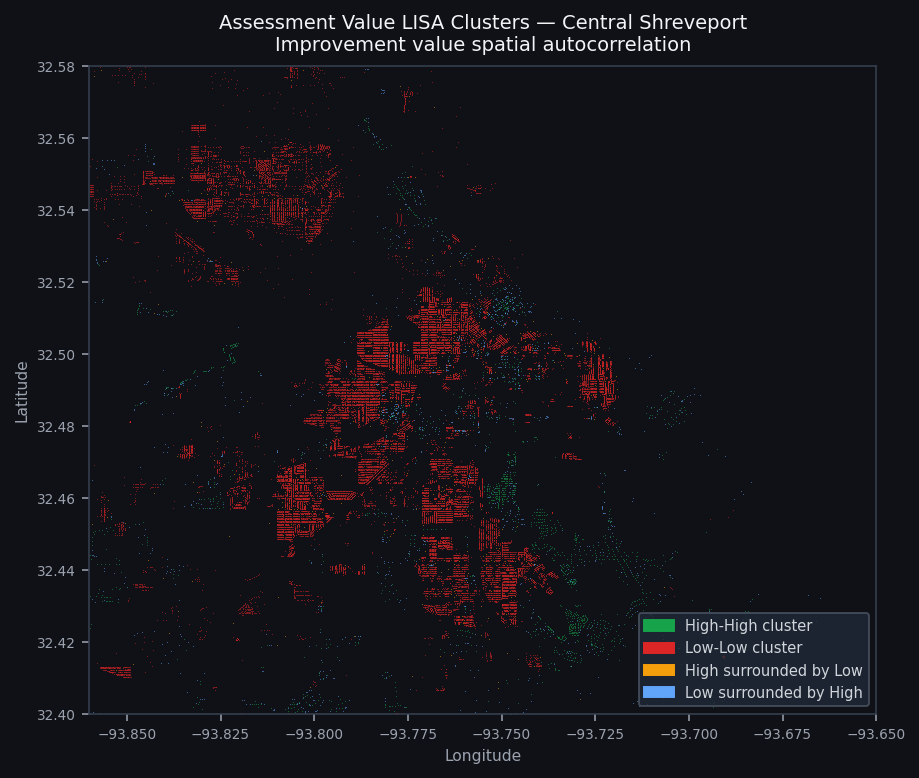
Improvement value spatial clusters — central Shreveport. Green = high-value clusters (HH); red = low-value clusters (LL); yellow/blue = transition zones.
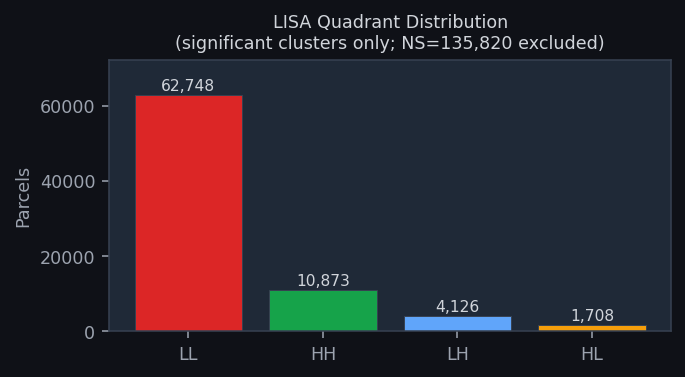
Significant cluster counts across 215K+ tri-parish parcels. 62,748 parcels in statistically significant low-value clusters vs. 10,873 in high-value clusters.
Dataset Fields